Home / Research / Hiring and AI
Do fields where AI and robots touch more of the workday have weaker hiring? We compared, for 47 job sectors, how much of a typical shift AI and robots already touch (our task data, weighted by how many people do each job) with how job postings on Indeed have moved since February 2020 (Indeed Hiring Lab, Oct 9, 2026).
What we found: the third of sectors with the most AI and robot time have postings at 89% of their 2020 level on average, against 125% for the third with the least. Across all sectors there is a moderate negative relationship (correlation -0.51), and almost no relationship with the past year's change (-0.15).
This is a comparison, not proof of cause. Postings rise and fall with interest rates, the pandemic hiring boom and bust, and industry cycles. Tech fields, for example, fell sharply after 2022 for reasons that started before generative AI. Use this as one signal among many.
| Sector (Indeed) | AI and robot time, typical shift | Postings vs Feb 2020 | Past year | Jobs on this site |
|---|---|---|---|---|
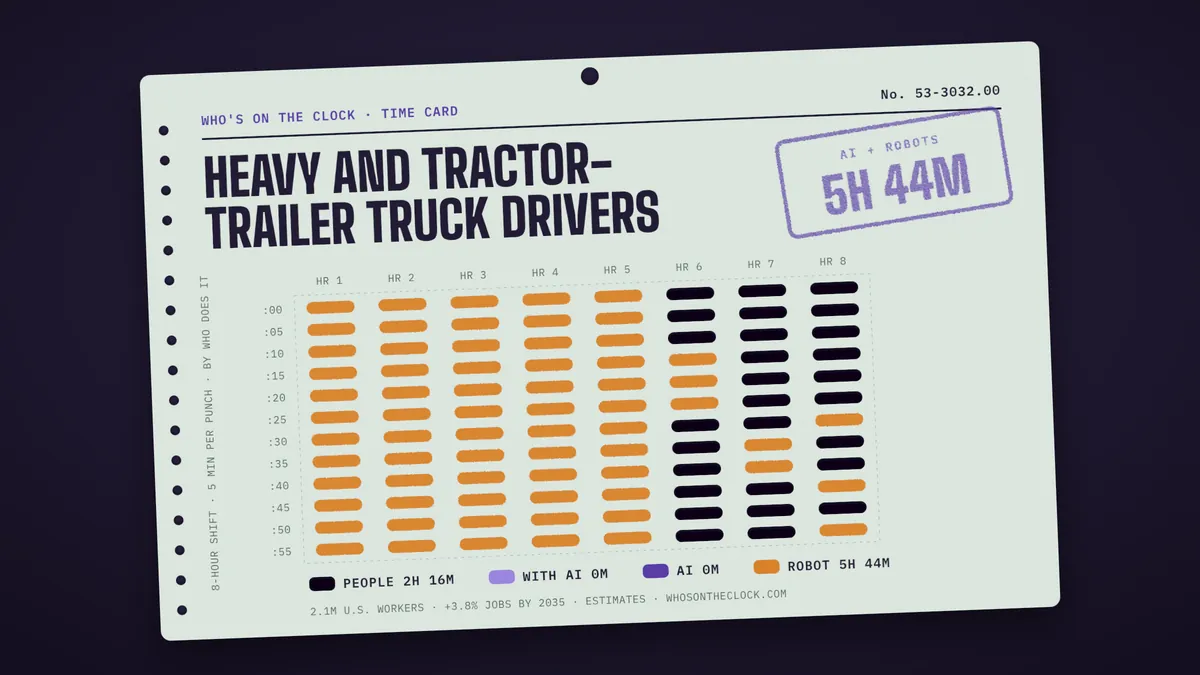
| Driving | 5h 29m | 81% | -8.5% | 8 |
| Marketing | 5h 28m | 75% | -4% | 3 |
| Customer Service | 4h 45m | 87% | -1.5% | 14 |
| Sales | 4h 39m | 92% | +1.5% | 14 |
| IT Infrastructure, Operations & Support | 3h 52m | 70% | +7.5% | 3 |
| Retail | 3h 51m | 90% | +4.2% | 7 |
| Software Development | 3h 29m | 78% | +21.5% | 5 |
| Administrative Assistance | 3h 25m | 96% | +0.6% | 14 |
| Loading & Stocking | 3h 24m | 109% | +12.4% | 15 |
| Medical Information | 3h 19m | 89% | -6.4% | 3 |
| Banking & Finance | 2h 56m | 106% | +10.8% | 13 |
| Media & Communications | 2h 43m | 69% | +6.8% | 17 |
| Cleaning & Sanitation | 2h 36m | 102% | +2.1% | 8 |
| IT Systems & Solutions | 2h 33m | 77% | +10.8% | 6 |
| Human Resources | 2h 31m | 99% | +18.9% | 6 |
| Accounting | 2h 27m | 105% | -5.9% | 9 |
| Hospitality & Tourism | 2h 20m | 83% | -5.2% | 10 |
| Physicians & Surgeons | 2h 8m | 202% | +8.8% | 19 |
| Data & Analytics | 2h 5m | 64% | +8.7% | 7 |
| Insurance | 1h 58m | 127% | +5.1% | 4 |
| Education & Instruction | 1h 57m | 107% | -9.5% | 65 |
| Security & Public Safety | 1h 50m | 119% | +4.4% | 23 |
| Pharmacy | 1h 46m | 127% | +4.2% | 3 |
| Scientific Research & Development | 1h 43m | 84% | +19.9% | 34 |
| Construction | 1h 27m | 129% | +6.4% | 58 |
| Legal | 1h 21m | 122% | +1.2% | 7 |
| Project Management | 1h 20m | 118% | +17.2% | 1 |
| Management | 1h 15m | 104% | +8.3% | 34 |
| Logistic Support | 1h 12m | 119% | +5.1% | 17 |
| Electrical Engineering | 1h 3m | 153% | +32.4% | 3 |
| Food Preparation & Service | 1h | 96% | -3.1% | 15 |
| Medical Technician | 59m | 125% | -2.6% | 31 |
| Civil Engineering | 52m | 163% | +6.3% | 2 |
| Production & Manufacturing | 52m | 124% | +12.6% | 101 |
| Arts & Entertainment | 51m | 87% | +12.4% | 21 |
| Mechanical Engineering | 50m | 168% | +43.4% | 14 |
| Social Science | 49m | 126% | -6.7% | 13 |
| Aviation | 49m | 120% | +12.4% | 6 |
| Nursing | 45m | 112% | -0.4% | 5 |
| Community & Social Service | 32m | 105% | -6.2% | 15 |
| Architecture | 29m | 92% | +5.5% | 5 |
| Personal Care & Home Health | 27m | 151% | +2.1% | 25 |
| Installation & Maintenance | 22m | 118% | +4.1% | 49 |
| Industrial Engineering | 18m | 124% | +38% | 11 |
| Dental | 17m | 117% | -14.9% | 6 |
| Childcare | 15m | 84% | -12.4% | 1 |
| Therapy | 9m | 188% | +3.2% | 13 |
AI and robot time: share of a typical 8-hour shift on tasks with AI use or robot deployments, averaged across each sector's jobs by employment (BLS, May 2025). Postings: Indeed Hiring Lab job postings index, seasonally adjusted, CC BY 4.0. Also on Indeed: 7.3% of all U.S. postings mention AI skills (2026-09-30).
Cite or reuse this
Who's on the Clock (2026). "Is AI Slowing Hiring? Job Postings vs AI Use." whosontheclock.com/research/hiring-and-ai/. Data: O*NET 30.1, Anthropic Economic Index, BLS May 2025, Indeed Hiring Lab; accessed Oct 20, 2026.
Data version: O*NET 30.1, Anthropic Economic Index (2025 usage, September 2026 robot study), BLS May 2025. Figures are estimates of task time, not measured hours, and don't predict job losses.