Will AI replace statisticians?

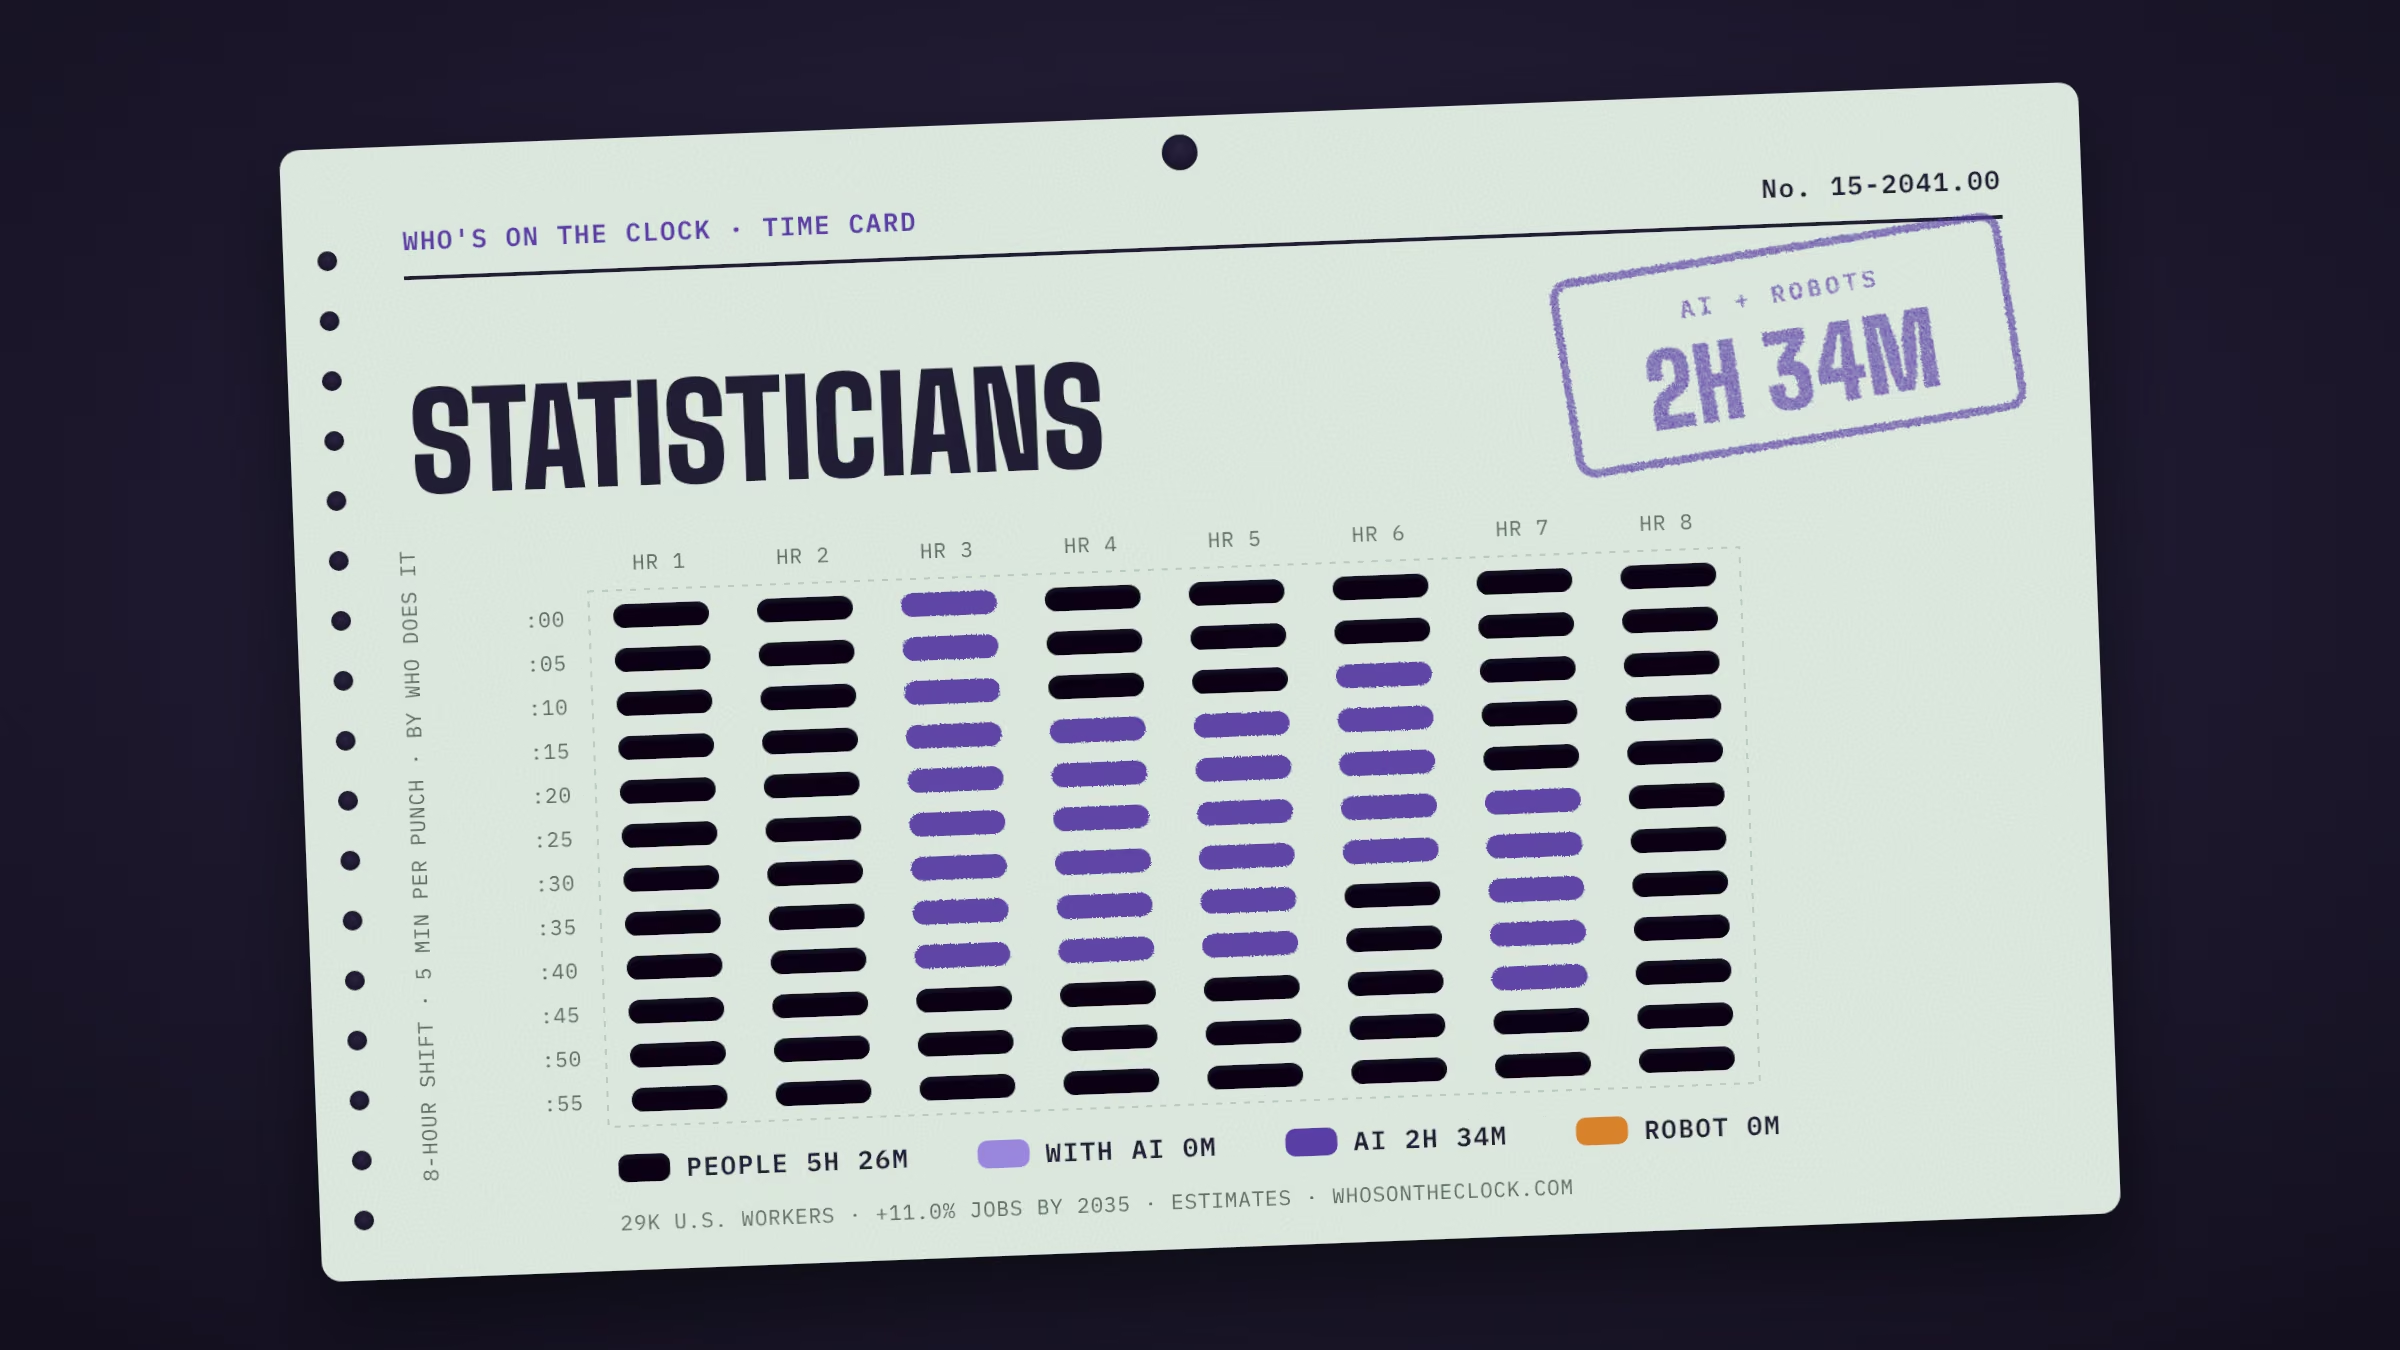
AI already handles some of this work on its own in real use, for tasks like “Report results of statistical analyses”. That's 2h 34m of a typical shift; 5h 26m still has no AI or robot evidence. BLS expects about 11% more of these jobs by 2035.

Time card for statisticians showing a typical 8-hour shift: 5h 26m done by people, 2h 34m by AI.
Each mark is 5 minutes of a typical shift for statisticians, colored by who does that task today. Estimates from O*NET tasks and Anthropic Economic Index data. How it's made

Home / Computers & math / Statisticians

Develop or apply mathematical or statistical theory and methods to collect, organize, interpret, and summarize numerical data to provide usable information. May specialize in fields such as biostatistics, agricultural statistics, business statistics, or economic statistics. Includes mathematical and survey statisticians.

Time card

Untick tasks you don't do, or set your own times.
MineTask, by time spentHumanWith AIAIRobot
Analyze and interpret statistical data to identify significant differences in relationships among sources of information.1h 5m a shift · No AI or robot evidence found
Why this label?No AI use or robot deployment showed up for this task in our data. That isn't proof it's safe; it may just be rare in the data. How labels work
Prepare data for processing by organizing information, checking for inaccuracies, and adjusting and weighting the raw data.53m a shift · No AI or robot evidence found
Why this label?No AI use or robot deployment showed up for this task in our data. That isn't proof it's safe; it may just be rare in the data. How labels work
Report results of statistical analyses, including information in the form of graphs, charts, and tables.47m a shift · Observed in AI useTypical AI request: about 10h 7m alone, 39m with AI
Why this label?Marked AI because this task shows up regularly in real AI conversations (Anthropic Economic Index, 2025 usage), and in most of them AI does the task on its own rather than helping a person. Many workplaces may not use AI for it at all. How labels work
Evaluate the statistical methods and procedures used to obtain data to ensure validity, applicability, efficiency, and accuracy.30m a shift · No AI or robot evidence found
Why this label?No AI use or robot deployment showed up for this task in our data. That isn't proof it's safe; it may just be rare in the data. How labels work
Identify relationships and trends in data, as well as any factors that could affect the results of research.30m a shift · Observed in AI useTypical AI request: about 6h 23m alone, 41m with AI
Why this label?Marked AI because this task shows up regularly in real AI conversations (Anthropic Economic Index, 2025 usage), and in most of them AI does the task on its own rather than helping a person. Many workplaces may not use AI for it at all. How labels work
Present statistical and nonstatistical results, using charts, bullets, and graphs, in meetings or conferences to audiences such as clients, peers, and students.30m a shift · No AI or robot evidence found
Why this label?No AI use or robot deployment showed up for this task in our data. That isn't proof it's safe; it may just be rare in the data. How labels work
Process large amounts of data for statistical modeling and graphic analysis, using computers.30m a shift · Observed in AI useTypical AI request: about 10h 33m alone, 50m with AI
Why this label?Marked AI because this task shows up regularly in real AI conversations (Anthropic Economic Index, 2025 usage), and in most of them AI does the task on its own rather than helping a person. Many workplaces may not use AI for it at all. How labels work
Determine whether statistical methods are appropriate, based on user needs or research questions of interest.24m a shift · No AI or robot evidence found
Why this label?No AI use or robot deployment showed up for this task in our data. That isn't proof it's safe; it may just be rare in the data. How labels work
Develop and test experimental designs, sampling techniques, and analytical methods.24m a shift · Observed in AI useTypical AI request: about 12h 52m alone, 1h 28m with AI
Why this label?Marked AI because this task shows up regularly in real AI conversations (Anthropic Economic Index, 2025 usage), and in most of them AI does the task on its own rather than helping a person. Many workplaces may not use AI for it at all. How labels work
Design research projects that apply valid scientific techniques, and use information obtained from baselines or historical data to structure uncompromised and efficient analyses.24m a shift · No AI or robot evidence found
Why this label?No AI use or robot deployment showed up for this task in our data. That isn't proof it's safe; it may just be rare in the data. How labels work
Develop software applications or programming for statistical modeling and graphic analysis.24m a shift · No AI or robot evidence found
Why this label?No AI use or robot deployment showed up for this task in our data. That isn't proof it's safe; it may just be rare in the data. How labels work
Report results of statistical analyses in peer-reviewed papers and technical manuals.24m a shift · Observed in AI use
Why this label?Marked AI because this task shows up regularly in real AI conversations (Anthropic Economic Index, 2025 usage), and in most of them AI does the task on its own rather than helping a person. Many workplaces may not use AI for it at all. How labels work
Adapt statistical methods to solve specific problems in many fields, such as economics, biology, and engineering.18m a shift · No AI or robot evidence found
Why this label?No AI use or robot deployment showed up for this task in our data. That isn't proof it's safe; it may just be rare in the data. How labels work
Plan data collection methods for specific projects, and determine the types and sizes of sample groups to be used.18m a shift · No AI or robot evidence found
Why this label?No AI use or robot deployment showed up for this task in our data. That isn't proof it's safe; it may just be rare in the data. How labels work
Evaluate sources of information to determine any limitations, in terms of reliability or usability.12m a shift · No AI or robot evidence found
Why this label?No AI use or robot deployment showed up for this task in our data. That isn't proof it's safe; it may just be rare in the data. How labels work
Apply sampling techniques, or use complete enumeration bases to determine and define groups to be surveyed.12m a shift · No AI or robot evidence found
Why this label?No AI use or robot deployment showed up for this task in our data. That isn't proof it's safe; it may just be rare in the data. How labels work
Examine theories, such as those of probability and inference, to discover mathematical bases for new or improved methods of obtaining and evaluating numerical data.6m a shift · No AI or robot evidence found
Why this label?No AI use or robot deployment showed up for this task in our data. That isn't proof it's safe; it may just be rare in the data. How labels work
Supervise and provide instructions for workers collecting and tabulating data.6m a shift · No AI or robot evidence found
Why this label?No AI use or robot deployment showed up for this task in our data. That isn't proof it's safe; it may just be rare in the data. How labels work
Prepare and structure data warehouses for storing data.6m a shift · No AI or robot evidence found
Why this label?No AI use or robot deployment showed up for this task in our data. That isn't proof it's safe; it may just be rare in the data. How labels work

Clock history

  1. 2h 34m touchedFirst published: O*NET 30.1, Anthropic Economic Index (2025 usage and September 2026 robot study), BLS May 2025

When new data changes this clock, the date, the new numbers and the reason are logged here. Company news alone never moves the clock.

On the floor

  1. Rolling outOpenAI
    OpenAI's internal data agent runs analysis for over 3,500 staff

    OpenAI's internal data agent writes and runs SQL, publishes notebooks and reports, and lets people outside the data team run analysis. It has more than 3,500 internal users across about 70,000 datasets.

    OpenAI

Ask the clock

Will AI replace statisticians?

Some tasks are already being done by AI or machines; the rest still needs a person. About 2h 34m of a typical shift is made up of tasks that AI or robots have done on their own in real use somewhere. That doesn't mean those hours are automated in a typical workplace. The other 5h 26m (68%) stays with people. Separately, BLS expects about 11% more of these jobs by 2035 (all jobs: +3.5%).

What can AI already do for statisticians?

AI shows up regularly in 5 of 19 tasks, about 2h 34m of a typical shift. The biggest ones:

  • Report results of statistical analyses, including information in the form of graphs, charts, and tables. (47m a shift, AI mostly does it alone)
  • Identify relationships and trends in data, as well as any factors that could affect the results of research. (30m a shift, AI mostly does it alone)
  • Process large amounts of data for statistical modeling and graphic analysis, using computers. (30m a shift, AI mostly does it alone)
  • Develop and test experimental designs, sampling techniques, and analytical methods. (24m a shift, AI mostly does it alone)
  • Report results of statistical analyses in peer-reviewed papers and technical manuals. (24m a shift, AI mostly does it alone)
What still needs a person?

5h 26m of a typical shift, or 68%, goes to tasks with no AI or robot evidence yet. No AI usage or robot deployment has shown up for these so far. The biggest:

  • Analyze and interpret statistical data to identify significant differences in relationships among sources of information. (1h 5m a shift)
  • Prepare data for processing by organizing information, checking for inaccuracies, and adjusting and weighting the raw data. (53m a shift)
  • Evaluate the statistical methods and procedures used to obtain data to ensure validity, applicability, efficiency, and accuracy. (30m a shift)
  • Present statistical and nonstatistical results, using charts, bullets, and graphs, in meetings or conferences to audiences such as clients, peers, and students. (30m a shift)
  • Determine whether statistical methods are appropriate, based on user needs or research questions of interest. (24m a shift)
What are companies actually doing?

We track 1 sourced company move that affects this job. Most recent:

  • Jan 29, 2026: OpenAI's internal data agent runs analysis for over 3,500 staff (Rolling out)
How much time does AI save on these tasks?

For the 4 tasks in this job where AI shows up and timing data exists, a typical request takes about 10h 20m for a person alone and about 45m with AI. These are Claude's own estimates from real conversations in April and May 2026 (Anthropic Economic Index). They describe single requests, not whole workdays, and time saved on a task doesn't mean jobs are cut. The biggest gaps:

  • Develop and test experimental designs, sampling techniques, and analytical methods (about 12h 52m alone, 1h 28m with AI)
  • Process large amounts of data for statistical modeling and graphic analysis, using computers (about 10h 33m alone, 50m with AI)
  • Report results of statistical analyses, including information in the form of graphs, charts, and tables (about 10h 7m alone, 39m with AI)
Are employers still hiring statisticians?

On Indeed, job postings in the Data & Analytics sector are at 64% of their February 2020 level (all U.S. postings: 104%), up 8.7% from a year earlier, as of Oct 9, 2026. BLS separately expects about 1,900 openings a year in this job through 2035. Across all U.S. postings, 7.3% now mention AI skills. Sector postings cover more than this one job and move for many reasons besides AI.

How much do statisticians make?

The median pay is about $105,650 a year ($50.79 an hour), 107% above the median for all U.S. jobs ($50,980). Most people in this job earn between $64,000 and $174,050 a year; that range covers the middle 80%. Pay figures are from BLS, May 2025, and vary a lot by state and employer. Pick a state to compare:

Is this job growing or shrinking?

BLS projects growth of 11% from 2025 to 2035, compared with 3.5% growth for all jobs. That's about 35,000 jobs in 2035. It expects about 1,900 openings a year, mostly from people retiring or changing careers. These projections don't single out AI as a cause.

How many statisticians are there in the U.S.?

About 29,000 people in the U.S., roughly 0.02% of all workers (BLS, May 2025). That makes it the 483rd largest of the 796 jobs on this site. BLS expects about 35,000 in 2035.

What training do statisticians need?

The most common requirement is a master's degree: about 62% of people in the job said so in the official O*NET survey. O*NET rates the job at level 5 of 5 for preparation, which usually means: graduate degree. Requirements vary by state and employer, especially for licensed work.

What should I learn to stay ahead of AI?

These come from the job's official skill ratings and from the tasks that AI and robots touch least today. Building them keeps you strong in the parts of the work that still need a person:

  • Skills that matter more here than in most jobs: Mathematics, Programming, Science, Complex Problem Solving
  • Get strong at the parts of the job that stay with people (listed above), which take 5h 26m of a typical shift
  • Tools employers list: Tableau, Structured query language SQL, SAS, R, Python
  • Learn to use AI well on the tasks where it already shows up in this job (listed above)
What other jobs could statisticians move into?

These use similar skills, with less of a typical shift touched by AI or robots. Matches come from 109 official ratings of skills, knowledge and work activities, and each needs the same or less preparation unless the official list relates the jobs directly:

  • Biostatisticians (1h 27m touched, $106k median pay)
  • Actuaries (41m touched, $130k median pay)
How solid are these numbers?

Each task carries its own evidence label. For this job: 5 observed in real AI use, 14 with no AI or robot evidence found. The minutes per task are estimates, not measured hours, and "no evidence" doesn't prove a task is safe.

Tools in demand

  • Tableau
  • Structured query language SQL
  • SAS
  • R
  • Python

Plus everyday office tools: Microsoft PowerPoint, Microsoft Office software, Microsoft Excel.

Also called

Analytical Statistician, Applied Scientist, Applied Statistician, Biometrician, Clinical Analyst, Data Analyst, Data Analyst Specialist, Data Analytics Specialist, Data Coordinator, Data Engineer, Data Manager, Data Modeler, Data Science Specialist, Data Specialist